
Blog
Age Heaping
Sometimes economic and social historians have to get creative when trying to answer interesting questions using historical data. One of the things we would really like to know is how skilled and/or educated people were in the past. Education, or more commonly in the economic history literature – human capital, is an important determinant of a shift to sustained economic growth. Here we aren’t necessarily talking about formal education, but about skills which prove useful in improving how productive people are and how they plan their lives (financially, practically, romantically etc.). One of these skills we are interested in is numeracy (the ability to count and use numbers) but unlike literacy, for which some insight can be gleaned from the recording of signatures or simple crosses on various registration documents, numeracy is never directly recorded at the individual level. However this doesn’t mean that all is lost, because sometimes when one moves beyond the individual level and looks at aggregate statistics patterns can be observed which can provide surprising insights. This is where age heaping comes in.
https://www.researchgate.net/publication/51746845_Comparative_Analysis_of_Old-Age_Mortality_Estimations_in_Africa
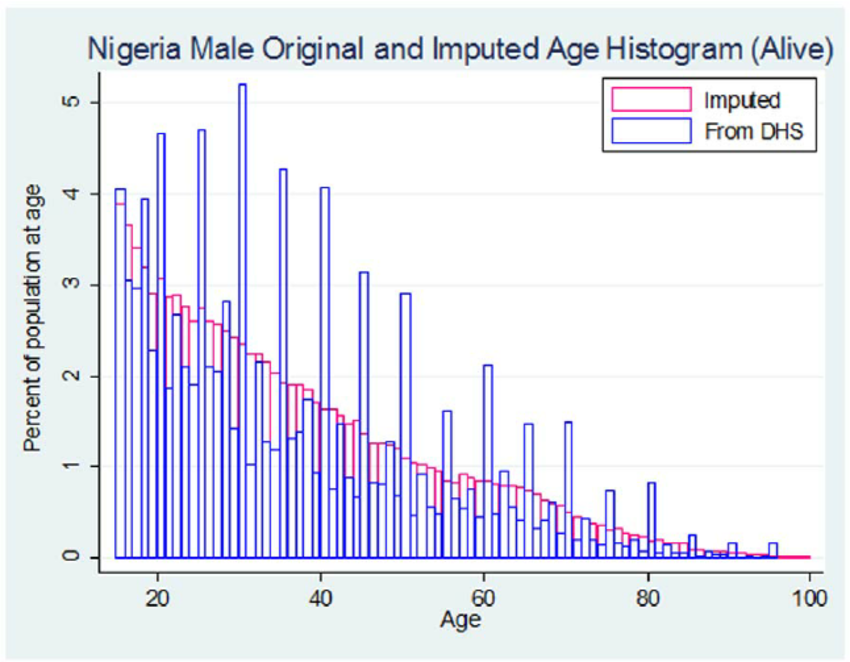
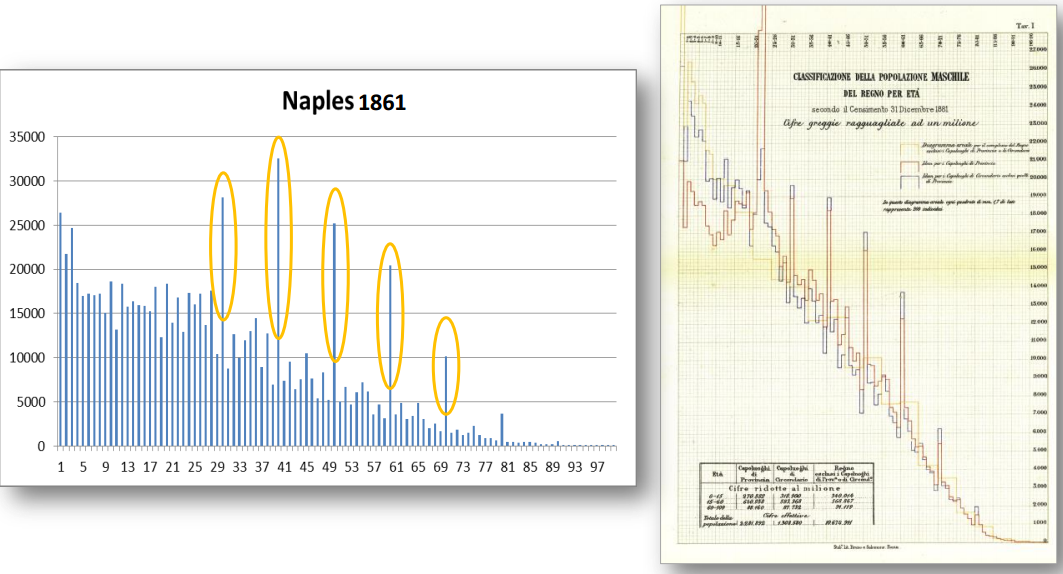
Age heaping is the tendency, when one is less familiar with numbers, to round your age to the nearest number ending in 5 or 0 (at least in Western Europe – in other parts of the world heaping may occur on other, fortuitous numbers). When you look at an entire population and observe how many people are rounding their ages on these digits then you can deduce to some extent, how familiar they are with numbers. For some parts of the world we still see marked age heaping. The graph to the right comes from current-day research on Nigeria and shows marked age heaping, particularly on multiples of 10, for Nigerian males in the Demographic Health Survey data (covering approximately the past 40 years). When we look to historical data the same phenomenon becomes apparent, but to lesser extents depending on where you look. Below is a graph that I have borrowed from this blog post, which shows age heaping in Naples in 1861.
From Emil O.W. Kirkegaard’s blog
One can observe clear age heaping for the older population, and from the image on the right it would appear that this is something the census takes were also aware of, and tried to correct for. The Neapolitan population, therefore, seems to have been relatively disposed to round their ages which suggests low familiarity with numbers. If we turn to the historical population of Amsterdam, however, we can see a different pattern emerging. Here the data is 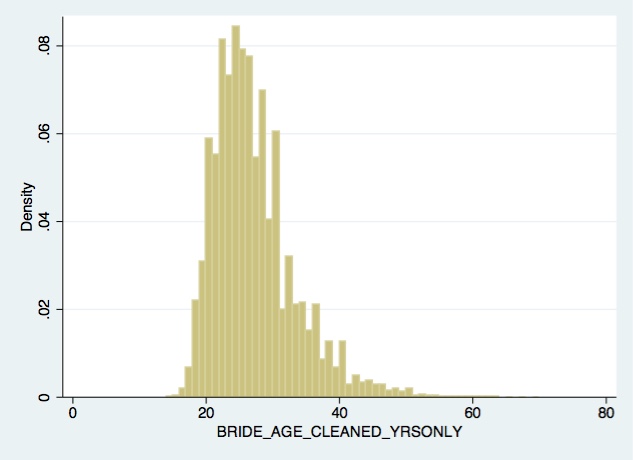 from the pre-marriage registers, which were digitalised as a part of the Ja, ik wil project (Yes, I do). The graph includes only the reported age of brides-to-be. Some heaping can be observed (the ages 50, 40 and 30 are particularly over-represented but so is 48 and 38). This data covers a period from 1581-1811 and suggests that women in Amsterdam were relatively used to working with numbers, which may well reflect the role that women played in trade and on the labour market.
For a dataset which allows for comparisons of numeracy scores based on age heaping between countries see https://www.clio-infra.eu/Indicators/NumeracyTotal.htmland here for a gendered perspective: https://www.clio-infra.eu/Indicators/GenderEqualityofNumeracy.html. Joerg Baten has worked extensively on this subject so his papers, many of which can be found here: http://www.wiwi.uni-tuebingen.de/lehrstuehle/volkswirtschaftslehre/wirtschaftsgeschichte/research/downloads.html are a good place to start further reading. And to link to another post on this blog, Tine De Moor and Jaco Zuijderduijn’s paper on Aetates Sui portraits is a very original take on how to capture ages.