
Blog
A silly debate? Leandro Prados de la Escosura’s contribution to the ‘beyond GDP’ debate
Review of Leandro Prados de la Escosura, Human Development and the Path to Freedom. 1870 to the Present. Cambridge UP, 2022.
The notion that GDP is an imperfect guide to well-being is arguably as old as the concept itself. Its limitations were for example already discussed in detail by Simon Kuznets, and these issues were a part of the debate in the 1940s between Richard Stone, Milton Gilbert and Kuznets about the exact measurement of National Income. There has since been an undercurrent of literature trying to compensate for the flaws of the official System of National Accounts, for example by incorporating inequality, or environmental problems, or health and education into the measured concepts. The Human Development Index, inspired by the welfare-theoretical work by Amartya Sen and developed by UNDP (United Nations Development Programme) is the best-known example of this new approach. Since the financial crisis of 2008, however, and the report by Stiglitz, Sen and Fitoussi (2018) the well-being debate has both broadened and deepened, and increasingly has had an impact on economic history. The core ideas are simple: firstly, the ultimate goal of economic development is not just an increased command over resources (as is measured by GDP), but the increase in overall wellbeing of the relevant population. Secondly, wellbeing is multidimensional – we do not live by bread alone, and health, political rights, education, a healthy environment, inequality etc. are also important dimensions that have to be taken into account when the ‘achievements’ of economies are assessed. However, it is not straightforward to interpret, sometimes very different, trends in the various concepts at the same time. One way to do this, is to aggregate the different dimensions into a single, composite index. But for a concept that has many dimensions, this is not an easy task. That we are interested in something multidimensional but that we would like to measure it by one single index, has led to the proliferation of attempts to solve this puzzle.
Economic historians have traditionally also struggled with these issues. The British Standard of Living Debate (when did British labourers start to profit from industrialization and growth?), the American ‘Ante-bellum growth puzzle’, the literature on the increase in wellbeing during the Interwar period, are examples of debates in which various indices of wellbeing and growth developed differently over time, questioning the use of ‘traditional’ measures such as real wages or real income. A more recent debate focuses on the period after 1980, when economic growth continued (albeit at a lower rate than before), but trends in inequality and health, suggest a stagnation in the increase of wellbeing.
Leandro Prados de la Escosura (LP), one of the leading economic historians who has published many innovative papers on European (and global) economic growth, has produced an ambitious contribution to this debate. It offers, on the basis of a rich dataset, a reinterpretation of the evolution of wellbeing in the world since 1870. He builds his new view on data about four dimensions of wellbeing: life expectancy, education, GDP per capita, and liberal democracy, the latter being an index of the quality of political institutions (and therefore the degree of political freedom). It leads to other insights into long term development of wellbeing. An important example of this new view is that between 1920 and 1950 wellbeing increased much more than the increase of GDP per capita suggests, because literacy and education continued to grow at a robust rate.
A researcher wishing to go beyond GDP and measure multidimensional wellbeing in the past, has to make a number of choices to get to a composite wellbeing index that charts the long-term trend. Firstly, how many and which dimensions to include (a question I return to below). Secondly, how to transform the series of the individual dimensions to make them comparable with each other – how to standardize series with very different scale. And thirdly, how to aggregate the various series. I will start with the second issue, as part of the innovation that is offered by LP relates to this. The problem is as follows: series for life expectancy, education, GDP per capita and democracy measure concepts with very different scales. GDP per capita at the world level increased by a factor 10 between 1870 and 2020 (from about 800 dollars in 1990 prices in 1870 to 8000 dollars in 2020). Life expectancy more than doubled – from 27 to 70 years on a global level –, years of education increased from 1,2 to 8, and the index of liberal democracy is constructed in such a way that the extremes are zero and plus 5. The fundamental difference between GDP series and the rest is that GDP grows exponentially – at a rate of on average 1,5% per year, whereas life expectancy and years of schooling (and liberal democracy) are bounded, they run up against natural limits. In Japan, for example, life expectancy is 84 years and still increasing, but at a very slow pace, because it is already so high. The same applies to years of education, which does not increase much anymore in the wealthiest countries. There is therefore a ‘natural’ tendency for the growth of wellbeing, in particular when dominated by life expectancy and education as in the Human Development Index, to slow down beyond a certain point. LP concludes from this that ‘an increase in the standard of living of a country at a higher level implies a greater achievement than would have been the case had it occurred at a lower level’ (p. 19).
LP has adressed this problem by applying a so called Kakwani transformation to the bounded series, which is, technically, a way to blow up growth at higher levels of the series, when increases in life expectancy and education are more ‘difficult’. The increase of life expectancy from say 27 years to 70 years becomes much more spectacular after being treated with Kakwani: the global average then rises from 0,027 to 0,35, or by a factor 12 (lower and upper limits of the series are 0 and 1 respectively); if it continued to 80 years the new Kakwani level becomes 0,614, or an increase by a factor 22. The rather ‘dull’ series of life expectancy suddenly becomes highly dynamic. A rise of life expectancy from 82 to 83 years has the amazing effect of increasing wellbeing from 0,74 to 0,83, or by 13%. It is not just the elderly who profit from this, the entire population sees it wellbeing exploding when life expectancy grows toward the upper limit of 85 years! Increases in education are inflated in the same way; for example, the first five years of education have the same effect on wellbeing as the increase of educational attainment from 16 to 17 years (I know university education is good, but is it that good?). An important result is that a composite wellbeing index based on these underlying series, will continue to show fast growth of wellbeing when it is getting really wealthy, but this is the result of the assumption on which the entire exercise is based that at high levels growth is more difficult and therefore should be rewarded more than growth at low levels. The post 1980 divergence between GDP growth and wellbeing, which plays such a fundamental role in the beyond GDP debate, however, largely disappears due to the Kakwani transformation.
GDP growth, on the other hand, gets compressed by LP. The log of GDP per capita is taken as the best measure of wellbeing (a not unreasonable assumption, as we tend to think about our incomes in terms of relative and not absolute changes). Moreover, for the standardization of the series a relatively high upper limit (goalpost) of 47.000 1990 dollars is chosen. The result of this is that all action takes place in the lower half of the index as only a few countries approach the high upper limit. The odd consequence of these transformations is that whereas in the real world GDP per capita in the long run increases much more than life expectancy and education, the indices – after Kakwani and log – show the opposite pattern: the average level of life expectancy and of years of education increases by 0,4% per year between 1870 and 2015, whereas income grows at only 0,1% per year, and political rights at 0,15% per year. The result, in brief, is that LP’s augmented human development index (AHDI) is largely driven by life expectancy and education.
The early 1930s clearly demonstrate where this leads to. Between 1929 and 1933, when the world economy collapses, mass unemployment peaks, democracy is on the defensive and Hitler seizes power – in short, during our worst nightmare -, the AHDI shows a remarkable increase in wellbeing, thanks to the increase in life expectancy and education, which overpower the declines in GDP per capita and liberal democracy (p. 32-34). By this standard, the world’s population was better off in 1933 than in 1929, a result that is, to say the least, challenging established views. This happy growth of wellbeing continues in the rest of the thirties (next data point is 1938), and between 1938 and 1950, the next year for which estimates are available. It explains the ‘superior’ development of wellbeing compared with GDP in the first decades of the 20th century, which is one of the main conclusions LP draws from his reconstruction.
The book presents estimates for wellbeing for key years, often per decade or per 5 year period (1933 is a bit of an exception). The story gently moves from 1938 to 1950, to 1960 and so on. There are no crises, no wars, the millions who died on the battle fields and in concentration camps, have no impact on this story – there is only the smooth increase of indices, the well-paved path to freedom. GDP series that are often available on an annual basis, show huge fluctuations: sharp depression in the 1930s, dramatic contractions as a result of the World Wars, which is at least one way to connect to the real tragic history of the 1930s and 1940s. The concepts that dominate LP’s story, life expectancy and years of schooling, move slowly in time, driven by long-term processes and grow gently. Not only are life expectancy and years of schooling relatively immobile, by focusing on the comparison of years of peace and stability, this tendency to get harmoniously growing indices is strengthened.
This brings me to the first choice made by LP: that of the dimensions included. There is no gender inequality in this study, no racism and slavery, no warfare and its brutal impact. There are no series which reflect the dark side of development such as biodiversity decline and pollution. When LP discusses inequality it is inequality between countries, not within countries. The argument for not including within country inequality is that good data are not available, yet he mentions two recent papers which have produced such datasets. The problem with the old, GDP based studies of economic development was that they were concentrating on the good news only – the worldwide growth of real incomes – but by focusing so much on two other indices which show the same happy global trends the picture does not become more nuanced (and even the 1930s become a success story).
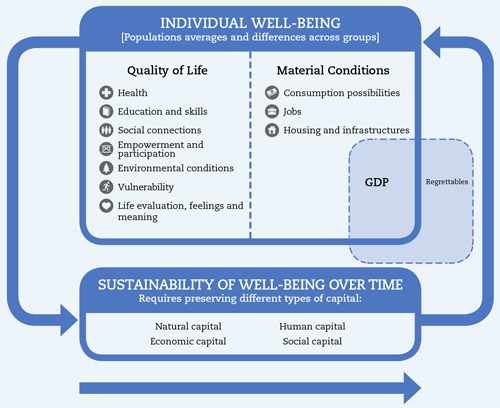
Framework How is Life?
What is needed are clear criteria about which dimensions should be included in composite indices of wellbeing, to go beyond the ad hoc choice based on subjective preferences of scholars and the availability of datasets. Sen, the intellectual grandfather of this research, is not going to produce a list of relevant dimensions – and the number of dimensions of wellbeing that are potentially relevant is endless. And the list becomes even longer when next generations are taken into account to deal with sustainability issues. In their ‘How is Life?’ studies the OECD has developed a framework for this, in which such choices are made by panels of experts (see figure 1 above. 11 dimensions are defined and measured, and via the capital accounts the issue of future generations is covered. Much more can be said about this, but it is probably the best, internationally agreed framework. This is also how it has been used in the two reports How was Life? from 2014 and 2021, edited by Marco Mira d’Ercole from OECD, Auke Rijpma and me (together with Joerg Baten, Conal Smith and Marcel Timmer – first report – and Mikolaj Malinowski for the second). The aim of these reports was to present the historical data to measure the various dimensions of wellbeing for the period 1820-2010, and to integrate them into one composite index of wellbeing. Global datasets of the evolution of the various dimensions of wellbeing are presented, and both reports conclude with discussing ways to estimate a composite index, based on the presented wide range of data. The odd thing about LP’s book is that he does not even mention these publications, which develop exactly the same agenda as is behind his research. In certain respects these How was Life? reports have the same limitations as LP’s book: they are first of all statistical overviews and experiments that keep the history of wellbeing at an arm’s length. And they identify ex post patterns, without presenting a thorough analysis of the ex ante driving forces of these changes. But it is strange that these publications have simply been overlooked by LP (who as a commentator was involved with at least one report).
What is missing in this literature is a theory explaining why wellbeing has changed so much over time. There is the ‘old’ story of economic growth, based on the increase in productivity made possible by the accumulation of ideas that started with the 17th century Scientific Revolution and the 18th century Enlightenment. Increases in real income then made it possible to invest more in health care, education, a clean environment etc. LP wants to distance himself from this view, rooted in growth theory. In the pages on the ‘Ultimate determinants of human development’ economic growth and technological change (other than technologies applied to better health care) are not mentioned as deep causes of the walk to freedom, and it is stressed that education and health improved also in countries that saw no rapid rise in health spending (p. 57). Is the explanation for the fact that economic growth is largely ignored as a driving force of the development of wellbeing that the author has become the victim of his own experimental calculations which he has taken for the truth? These assumptions result in a dataset in which 37% of the increase in global wellbeing is caused by the increase in life expectancy, and 32% is driven by education (p.57), leaving a meagre 31% for the rest. But rather than concluding that this is perhaps a bit too much and that his estimates may be biased, he takes this for a fact and argues that economic growth was not a driver of the process. His conclusion to chapter 2 illustrates this again: when listing the causes of human development progress he mentions ‘life expectancy was the main contributor’, ‘Education … was a steady contributor’, and ‘political and civil liberties…added substantially’ (p.64), but economic growth and technological change, the fourth subindex of the AHDI, is not mentioned at all.
In sum, via the selection of dimensions of wellbeing, the transformation and standardization of the relevant series, and their weighting, LP has created a highly subjective view of the evolution of the global standard of living in the period since 1870. The problem of subjectivity in constructing composite indices of wellbeing and in the larger wellbeing research has been receiving increasing attention. A highly convincing analysis of these links is presented in the paper by Amendola, Gabutti and Vecchi (2018), which compares various indices – including LP’s proposal – and concluded that they ‘are nothing more than a formal representation of the analyst’s ethical system’ and ‘We show how any history based on composite indices is one where both data and history play a minor role, if any.’ I think that there are ways forward in this discussion – international agreements to limit the impact of the preferences of individual scholars are probably part of the solution – but do not understand how LP can simply ignore this contribution and that of other scholars who have made similar points.
What are the policy implications? Should we conclude that countries can stop stimulating technology and economic growth, and instead focus on increased investment in health care and education – say, the Cuban model? This is not what LP writes, he does not really discuss policy implications, but it seems a logical conclusion. I think such a policy advise is dangerous for a number of reasons. There is, to begin with, no alternative (yet) for the standard explanation of the rise of wellbeing in the past 200 years being based on productivity growth made possible by the cumulative growth of knowledge. Economic growth was and is a crucial link in this story: it was and is made possible by productivity growth, but also results in the high income levels that can – via social transfers and private money flows – be transformed into better health care, or less pollution, or more personal security. Moreover, economic growth leads to higher income levels, its ‘product’ is fungible, can be transformed in whatever is required, whereas an increase in life expectancy by two years is simply that, and cannot be transformed in more education. The key phenomenon is, I would argue, not economic growth itself, the increase in per capita GDP, but the underlying growth of productivity, which simply means that we (or our machines) become smarter over time, that we can do more with less effort. Part of this getting smarter has in the past been used to lower our labour input and increase leisure – and if we prefer zero-growth or even negative growth this can be realized by working less and less hours (which also supposedly increases wellbeing). And the rest was used to increase real income.
Growth theory supplies us with a rather convincing explanation of the increase of productivity in the past 200 years, which directly and indirectly has been the main driver of the increase of wellbeing in the past. We do not have a similar theory explaining the increase of life expectancy, education, political rights, or wellbeing in general. The source of inspiration of LP’s research into wellbeing is Sen’s capabilities approach, but that is a social-philosophical framework for the conceptualization of wellbeing, not an economic historical theory about the causes of the growth of wellbeing in the past. In the slipstream of economic growth and scientific progress, life expectancy has increased dramatically, so in a way it is part of the same process explaining economic growth. But LP’s results about the enormous impact of life expectancy on wellbeing are not the result of new insights into the effect of health on economic growth – or another new feedback loop between them – they are simply based on the statistical assumptions used. Nor has the book disclosed new theoretical ideas about the link between education and wellbeing – the contribution of education to wellbeing is simply measured in a different way.
Let me conclude by repeating that multidimensional wellbeing is a important guide for the ex post assessment of the outcomes of economic development, and in that sense a valuable tool for policy review, but it is not an ideal instrument for ex ante policy advice for stepping up economic development as we lack a theory explaining it. A second conclusion might be that GDP is flawed; it has, as all concepts in the social sciences, serious limitations, but for studying long term economic change it is still better than anything else we have available (as demonstrated by LP in many pioneering papers about the construction of long time series of GDP and their analysis, most recently Prados de la Escosura and Rodríguez-Caballero 2022).
I finish with what a colleague recently wrote to me: ‘As someone from a developing country, I really just laugh at these silly debates. OF COURSE GDP is important! Income is the only thing poor people care about: sure, their lives can improve with better public services or better technology imported from abroad, but these things can make 10% of the difference whereas more income will make a 90% difference. ’
References
Amendola, Nicola, Giacomo Gabutti, Giovanni Vecchi (2018), On the use of composite indices in economic history. Lessons from Italy, 1861-2017. HHB working paper series 11. https://www.hhbproject.com/media/workingpapers/11_amendola_gabbuti_vecchi_omoQ4rV.pdf
Prados de la Escosura, Leandro, and C. Vladimir Rodríguez-Caballero (2022), War, Pandemics and Modern Economic Growth in Europe. Explorations in Economic History, available online
Stiglitz, J.E., A.. Sen and J.P. Fitoussi (2009), Report by the Commission on the Measurement of Economic Performance and Social Progress’. https://ec.europa.eu/eurostat/documents/8131721/8131772/Stiglitz-Sen-Fitoussi-Commission-report.pdf
Zanden, Jan Luiten van, Joerg Baten, Marco Mira d’Ercole, Auke Rijpma, Conal Smith, Marcel Timmer (eds.) (2014) How Was Life? Global Well-Being since 1820. OECD, Paris. https://www.oecd.org/wise/how-was-life-9789264214262-en.htm
Zanden, Jan Luiten van, Marco Mira d’Ercole, Mikolaj Malinowski, Auke Rijpma (eds.) (2021) How Was Life? II, Perspectives on Well-Being and Global Inequality since 1820. OECD, Paris. https://www.oecd.org/dev/how-was-life-volume-ii-3d96efc5-en.htm