
Blog
How to measure the impact of slavery on the early modern economy?
Written by Jan Luiten van Zanden
NWO, the National Science Foundation of the Netherlands, has a usually rather boring glossy in which it presents the successes of the research funded by the organization. Recently, however, it published the summary of a debate, significantly printed in black and white, about the importance of the slave trade for the Dutch economy in the 18th century. In 2019 two scholars linked to the International Institute for Social History, Pepijn Brandon and Ulbe Bosma, published a study, which has attracted much attention from the media, to estimate the share of the Atlantic slave trade and slave-based plantation economy in the GDP of Holland and the Netherlands at about 1770. Their estimates were that about 5% of Dutch GDP and 10% of the GDP of the province of Holland consisted of slave-related activities.
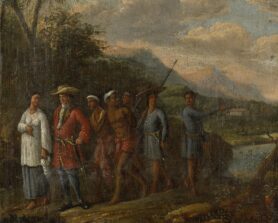
Dutch Merchant with Slaves, anonymous, 1700 – 1725. Rijksmuseum, Amsterdam.
That may have come as a shock – as the media presented it as a rather high figure – and it certainly was a shock for the Leiden historian Pieter Emmer, who has invested an entire career in the Dutch slave trade, but has continued to stress that its role was ‘marginal’. In interviews he gave after his book on the history of the Dutch slave trade was published in the same year, 2019, he maintained that the Dutch slave trade contributed only 0,005 percent of Dutch national income, so one-thousands of the estimate by Brandon and Bosma! He repeated this undocumented estimate in a number of interviews. Asked to comment on the difference by Dutch newspaper NRC Emmer had not really tried to explain the gap, but said ‘wellicht moeten ze stevige conclusies trekken om NWO-financiering van het onderzoek te rechtvaardigen’ (perhaps they were induced by NWO-funding to draw such strong conclusions).
In the same interview, he had called the results by Brandon and Bosma ‘absurd’.
What all authors seem to agree about, is that the way to assess the importance of the slave trade is to estimate its share in GDP or national income. I am not sure. And I will try to explain why this is not a good measure. To begin with, it requires a definition of the borders of the slave-based economy, which may be debatable. Brandon and Bosma, for example, not only include the trade-in coffee and sugar from the plantation economies of the Caribbean to the Netherlands in their calculations, but also the re-export of those commodities to, for example, the Baltic. The argument is that these re-exports were dependent on the original trade flow between (mainly) Surinam and Holland. But this may lead to double-counting: a study of the contribution of the Baltic trade to Dutch GDP would also include this trade flow, and perhaps, following the same logic, the re-exports of Baltic goods to Surinam. So the total ‘contributions’ of all economic sectors to total GDP will be larger than GDP itself, which is problematic.
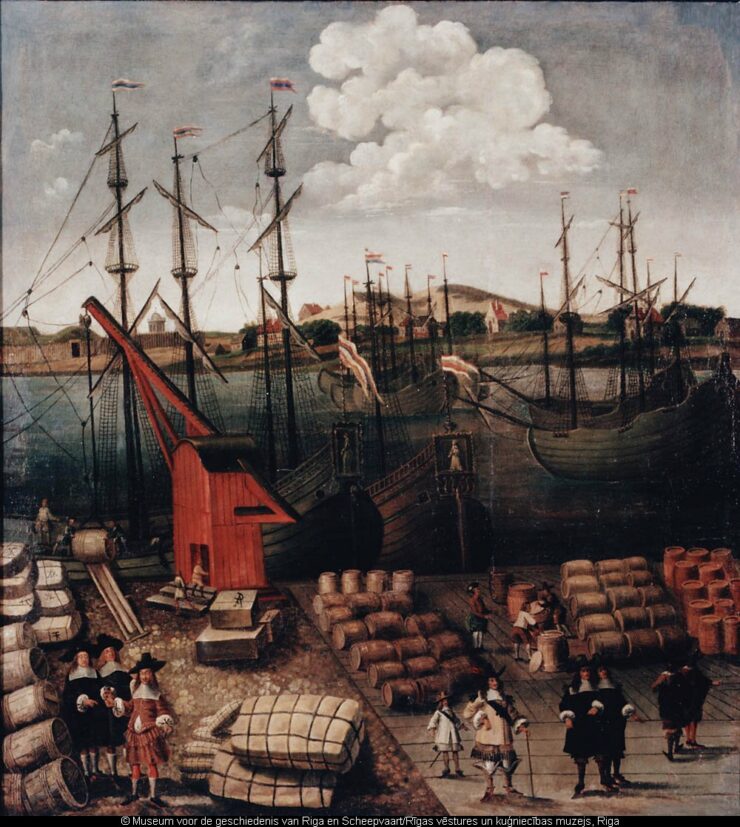
Riga harbour in the second half of the 17th century. A number of Dutch merchant ships are in the port to be loaded or unloaded. Museum voor de geschiedenis van Riga en Scheepvaart, Delpher.
A related issue is that it is unclear, given that in an economy everything is related to everything else, where to stop this causal chain: why not also include the imports from the Baltic, which were bought with the coffee and sugar from Surinam? And why not include the shipbuilding industry which used the timber that was imported from the Baltic, which was paid for by Surinam products? The ultimate logic would be that 100% of GDP is directly or indirectly related to the slave trade, which might be true, but the same would apply to the Baltic trade, or to the brewing industry, or any other branch of the economy. A related problem is that the implicit assumption seems to be that without slavery, GDP would have been reduced by the estimated percentage (10% for Holland), but we simply do not know what the alternative scenario without slavery would have looked like. Most economists would assume that the entrepreneurship, the capital and the (free wage) labour now invested in the slave-based economy would have found alternative opportunities for employment. If those alternatives would, for example, have yielded about half the income that was earned in the slave-based economy, then the ‘contribution’ of slavery to GDP could be estimated at half the share of the sector in GDP (according to the Brandijn/Bosma estimates 2,5% of GDP of the Netherlands). But would this alternative have yielded 50%? Or 80%? Of perhaps even 100%, as the Dutch slave trade was not really very profitable?
Another problem, which leads to biases in the opposite direction, is that a share in GDP is a static concept, which also does not measure the contribution to well-being. The slave-based Atlantic economy was a highly dynamic part of the early modern economy, which was able to generate substantial productivity growth, which resulted in a strong decline of the relative prices of the commodities produced for the European market, such as sugar, coffee and cotton. Consumers profited most of the growth of the slave-based economy, but the vast increase in the consumer surplus they enjoyed due to falling prices also suppresses the share of the slave-based economy in GDP. So one way to look at this is that the share of the slave-based economy remained low – ‘marginal’ is the word used by Emmer – due to its dynamic growth and its large contribution to the increase of the consumer surplus. Again, the share in GDP can be a misleading concept.
But the most serious limitation is that these estimates of ‘share in GDP’ only cover part of the slavery and slave trade that existed in the ‘Dutch’ economy. These estimates focus primarily on the Atlantic economy, in which slave labour was the central factor of production in an expanding plantation economy, which was producing commodities for the world market. In Asia and Southern Africa, the VOC and its employees also traded in slaves and used them intensively in all kinds of port-related activities, in agriculture (in the Cape Colony, and in the cultivation of nutmeg and mace on Banda) and in domestic services. From the early days of the VOC, slaves had been employed to build infrastructure (such as the castle in Batavia), and the related slave trade was, according to recent estimates, as large as the Atlantic slave trade. But these slaves did not contribute directly to Dutch GDP, and have therefore not been included in the recent estimates. This clearly shows the limitations of the approach focusing on share in GDP.
Slavery was first of all a source of labour, and the best way to estimate its importance is to measure the part of the labour force in a certain economy that was enslaved. Such a measure is easy to understand and does not suffer from the limitations of the share in GDP-approach discussed before. The main ‘problem’ is to define the borders of the ‘Dutch’ economy. We usually think in terms of countries – nation-states – with clearly defined borders, but the Dutch economy of the Golden Age did not coincide with such a territorial entity. Surinam and the other ‘Dutch’ plantation economies of the Caribbean, the Cape Colony and the VOC factories and port cities (such as Batavia) belonged to the economic sphere of the Netherlands, as they were controlled from Holland and Zeeland, governed by Dutch/VOC officials, and were entirely integrated into the Dutch commercial networks.
Cape Town or Surinam is perhaps more integrated into the Dutch commercial empire than Drenthe or Limburg. The borders of the Dutch commercial empire were not sharp, and perhaps the hinterlands of some of these port cities on West Java or Sri Lanka gradually became part of the same ‘empire’, but we have not included these regions as well, which is perhaps a bit arbitrary.

View of the Coffee Plantation Marienbosch in Surinam, Willem de Klerk, 1829 – 1876. Rijksmuseum, Amsterdam.
For the Netherlands there is a similar problem – should we focus on the commercial core, on Holland and Zeeland only, or also include the rest of the country? This issue also arose in the Brandon and Bosma paper. I follow their ‘solution’ and make two estimates, for the entire Netherlands and for Holland only – but to the latter, I also added Zeeland, as this was the province most involved in the slave trade. Moreover, I added the population of Surinam, the Cape Colony, and all employees of the VOC, to cover the entire ‘empire’. The measure that I propose for the importance of slavery for the ‘Dutch’ economy is the share of the entire slave population active in the Dutch commercial empire (in the east and in the west) of the total labour force of this empire. In other words, how dependent was this empire on slave labour? Was 2% or was 25% of the labour supplied by slaves?
The results are as follows: at about 1650 there were about 43 thousand slaves in the extended Dutch economy, and they accounted for 3,8% of the labour force of the Dutch empire, and 6,8% if we only focus on Holland and Zeeland as the denominator. In 1770 the number of enslaved had increased to 180.000 (100,000 in the Atlantic world, 80,000 in VOC empire), or 13,8% of the Netherlands+ labour force, and 24% of the Holland/Zeeland+ labour force.
These estimates are much higher than those of the share of the slave-based economy in GDP, mainly because slavery in the east is now included. I think they give a fair assessment of the degree to which this economy made use of slave labour, and how this increased over time. One can of course argue that most slave labours were unskilled and that the most productive, and best-paid jobs were found in the free sector. The average remuneration in the slave economy will have been much lower than in the free sector, explaining the rest of the difference between these two approaches. However, this kind of reasoning presupposes a free labour market, and that was obviously not present in the slave-based economies.
For the fans of GDP-estimates, these figures can also be converted in a share in national income, as we know that the share of the remuneration of unskilled labour in GDP was about 50 to 60%. Remaining on the safe side by assuming 50%, these estimates imply that the share of the slave labour in GDP in 1770 was almost 7% of the Netherlands+ GDP and 12% of the Holland/Zeeland+ GDP, clearly higher than the Brandon/Bosma figures.
These estimates show the importance of slavery for the Dutch economy of the 17th and in particular the 18th century. It was definitely not marginal. And it was growing rapidly until the final decades of the 18th century. But is this the ‘final word’ in the debate? Is this really what we want to know? I think the ‘deeper’ question is not about share in GDP or labour force, but about the violence, the suffering, the premature deaths, the pain that those enslaved endured. If economic history is about the ups and downs of human well-being, then we want to know how dramatic the decline in well-being was due to the enslavement of these people. Slavery was (in the approach developed by Sen, which sees development as the gradual increase of freedom) the ultimate ‘bad institution’, which took away almost all the agency people had and dehumanized them. As historians we are powerless in the face of the violence that it entailed – we have no means to assess the huge decline of well-being that the enslaved faced. But we should try. How much was life expectancy shortened for those that were captured, sold to the slave traders and transported to the Americas? And what we also should try to understand much better are the long term effects of slavery on economic and societal development: how did it impact on trust, on family networks, on work ethic, on many other aspects of society, with possible highly negative long-term effects on the institutions of these societies and the opportunities for the development of the enslaved.
Sources:
- Brandon, P. and Bosma, U., 2019. De betekenis van de Atlantische slavernij voor de Nederlandse economie in de tweede helft van de achttiende eeuw. TSEG/ Low Countries Journal of Social and Economic History, 16(2), pp.5–46. DOI: http://doi.org/10.18352/tseg.1082
- P.C. Emmer, Geschiedenis van de Nederlandse slavenhandel. Nieuw Amsterdam, 2019. The interviews in which he mentions the 0,005 percent estimate are with HPdeTijd 29-1-2019 and with Volkskrant 6-1-2018; I asked him via email about the basis for this estimate, but he blames the journalist(s) for making this mistake: “dan heeft de journalist die extra nullen toegevoegd aan de 0,5% volgens de berekening van Emmer/Eltis/Lewis”; it is odd, however, that two different journalists made the same mistake! And that Emmer did not care to correct them.
- Matthias van Rossum, Kleurrijk Tragiek. De geschiedenis van de slavernij in Azië onder de VOC. Verloren, Hilversum, 2015. Presents estimates of the slave population in east and west.
- Johan Fourie and Jan Luiten van Zanden, GDP in the Dutch Cape Colony, South African Journal of Economics Vol. 81:4 December 2013, pp.467-490. Population estimates were converted into estimates of the labour force, assuming that this ratio is 0,4 for free workers and 0,7 for slaves.
- See also my blog on the ethical issues concerning the slave trade (in Dutch): https://www.mejudice.nl/artikelen/detail/dubbele-moraal-van-nederland-tijdens-slavenij